

My hometown of Perth, Western Australia, is the most isolated city in the world, and with that knowledge, I believe, often comes the belief that we are somehow isolated from things that impact the rest of the globe. However, this is not the case with climate change.

Although Perth may be far removed from the rest of the world, evidence for climate change in the southwest of Australia demonstrates that we are part of a global ecosystem, one that is suffering terribly under global warming. In a moment of amateur meteorology, I went on the Australian Bureau of Meteorology website and began examining their statistics on climate change for the southwest of Australia. It was a fascinating exercise, as I watched the raw data align with the trends that I’d read about in the IPCC reports. I thought I’d share some of the statistics and my observations. My purpose is not to speculate on the future, or even to find cause for the trends (though I am a firm believer in anthropogenic climate change). It’s my hope that the data will speak for itself, revealing how Perth’s climate has been transformed over the last century. We’re not as disconnected from the rest of the world as we sometimes believe.
Let’s get started…
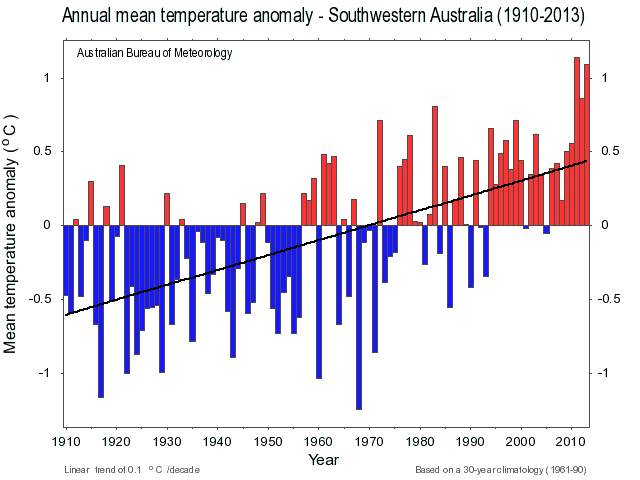 The chart above shows the annual mean temperature anomaly for southwest Australia from 1910 to 2013. Temperature anomalies are measured against a long-term average; in this case, based on mean temperature between 1961 and 1990. The black line represents the linear trend, with an increase in mean temperature of 0.1° per decade.
So you can see that at the beginning of the twentieth century, the annual mean temperature was 1.1° cooler than it is now. The spike in temperature since 1970 corresponds to IPCC concerns that current temperatures are unprecedented.
1.1° may not seem like such a big increase, but it needs to be understood in a historical context. In the same time period, global air and sea surface temperature has risen 0.8°; Perth is therefore warming at a faster rate. Evidence shows that global temperature has been relatively stable over the last one or two thousand years – a rise of even 1° is a significant increase. Unfortunately, the BOM don’t have reliable data for SW Australia that extends back before 1900.
But what about rainfall?
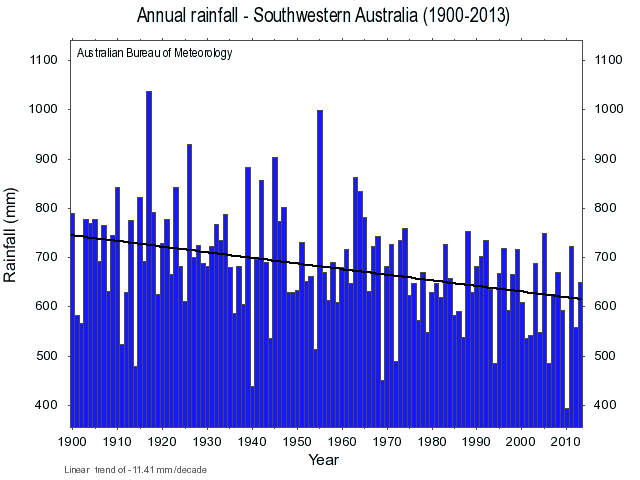 This chart quite clearly demonstrates the declining rainfall in the southwest region. There’s a linear trend of -11.41mm each decade, which is pretty significant. 2010 was a particularly poor year for rain.
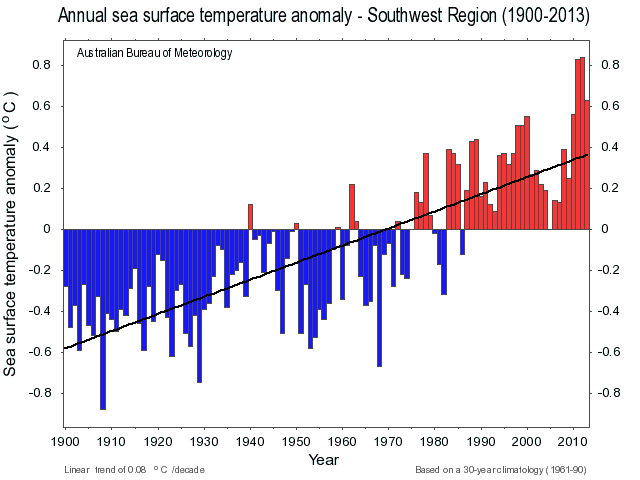
There has also been a corresponding rise in sea surface temperature (SST), which is hardly surprising considering that the Fifth IPCC report estimates 93% of the excess heat energy stored by the Earth in the last fifty years is stored in the ocean.
At least the water won’t be so cold at Cottesloe Beach!
But let’s compare that to a map of SST for the entire Australian region…

This doesn’t paint a nice picture for our oceans. Even the slightest increase in SST can cause irreparable damage to coral reefs. And rising ocean temperatures can contribute to severe weather patterns, particularly the El Niño Southern Oscillation in the Pacific. To write that the continued increase of SST would be disastrous would be a complete understatement.
But it’s not all bad news…
 Pan evaporation simultaneously measures several climactic factors, including temperature, humidity, and solar radiation. It’s quite self-explanatory: an evaporation pan is filled with water, and scientists measure the amount of evaporation. SCIENCE!
Global pan evaporation rates were decreasing in the fifty years before 2000. Many scientists attributed this to a cause known as global dimming, which is the reduction of direct irradiance at the Earth’s surface due to an increase in particulates. Basically, all the aerosols we’re pumping into the atmosphere are blocking out the sunlight. However, since 2000, the global pan evaporation rates have slightly improved.
In southwest Australia, in good old P-town, we seem to have been bucking the global trend. There’s been an increase of pan evaporation of 39.96mm per decade since 1975.
I’m not going to discuss the possible causes of the increase in pan evaporation in SW Australia in this article – that can be a discussion for another day. But it’s good to know that the air over Perth isn’t as potentially damaging as other cities.
And that brings me to the end of my foray into Perth’s climate. It’s been a fascinating topic – something I will definitely return to in the future.
All charts and data came from the Bureau of Meteorology.
More info on climate change in Western Australia can be found at the BOM website or here.
